Ayasdi AML

Case Study

HSBC - Anti Money Laundering

Project Info

Updating the Ayasdi enterprise anti-money laundering app experience and visual design for HSBC.

The Challenge

To create task pathways with various points of entry and exit for different users. The HSBC AML app had to accommodate many user types; data entry, data analyst, managers, and auditors. Permissions revealed a complete or partial journey depending on roles.
 
Update look and feel from the previous product. The previous product was plain and uninspiring as well as hard to use. Customers wanted something that made a repetitive task easier and more delightful.
 
To create a simple onboarding joyride using balloons to show new features as well as how to use and access them.

HSBC paid $1.92 billion in fines to U.S. authorities for allowing itself to be used to launder drug money.

Client

HSBC

Dates

05/2018-12/2018

Responsibilities

– UX analysis/research (flows and persona)

– Design (visual and interaction)

– Lo-fi prototyping (basic flow and interactions)

– Hi-fi prototyping (final designs for approval and handoff to dev)

The Approach

Rapid and agile ideation. White-boarding ideas, both good and bad. Then creating very basic wireframes to be used as simple click-through prototypes to refine flows.

Early wire-frames in sketch. These became a preliminary click-through to work out flow ideas. They were also used in preliminary customer testing.

Try out early click flow test v1
Sample screens from click through testing

Testing was performed by staff data scientists, product managers, and later versions by the CEO and upper management.

PMs also tested this early version with a few select customers/power users.

Some charts were thrown in for dramatic payoff including a couple of sample topological plots.

Try user flow test v2 or user flow test v3

First version of flow diagram made from feedback of early click throughs.

The evolving version of the flow diagram after notes and comments from testing new versions of the click throughs.

More formalized card flow diagram. This was the starting point to begin to finalize features as well as how to get to multiple customer journeys.

One of the main desires for the final project was a non-linear work flow. The cards in the top navigation gave status to concurrently rendering processes. The user could go into each section and check progress as well as results for completed activities.

Card navigation is used throughout the product allowing users to preview and compare different models and drill deeper into selected ones.

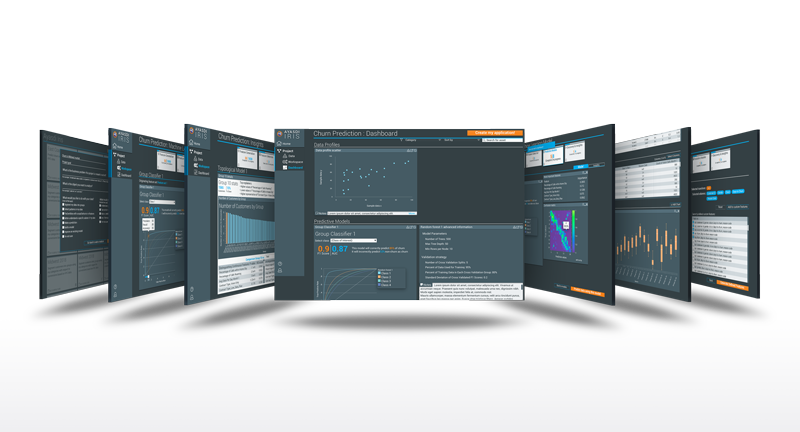
Interactive charts were designed to show the power of Ayasdi’s predictive modeling algorithms. A heatmap to show the accuracy of predictions and a modeling curve that could be adjusted with a slider for accuracy, precision, and recall.

Visualizations and charting were customizable and an invaluable tool for data insights.

Topological models were what really set Ayasdi apart. Using these models, data was visualized and groupings and outliers are revealed. Interactive charting is combined with the model allowing a user to tune the thresholds within each model to make predictions and insights that might never occur looking at a flat data set.

Pertinent data insights, visualizations, models, and charts could all be pinned to a dashboard. These dashboards could then be set up to monitor trends in the data as well as be used as presentations or documentation.  Notes could be attached for reference or explanation for handoff.

Ayasdi Core Design System

Case Study

Ayasdi - Core Design System

Project Info

While designing multiple products for Ayasdi, I created this design system and guide to house a living inventory of UI components. Anyone working on Ayasdi products was able to reference this guide and its associated InVision page or sketch cloud page for specifications, copy component-specific CSS or download actual sketch components.

The Challenge

To refine Ayasdi’s visual language to be simpler, more concise, and use color in a communicative way.

This design system expedited my process as well as becoming a style reference for both local and offshore developers.

Client

Ayasdi

Dates

05/2018-12/2018

Responsibilities

– Design (visual and interaction)

– Hi-fi prototyping (final designs for approval and handoff to dev)

The Approach

Develop a single, unified system that was transferable across all platforms and devices as well as having the majority of components function in either a dark or light theme.

The color system was based on Ayasdi’s logo colors.

Ayasdi orange became a color of immediacy to be used for important messaging as well as CTAs.

The cyan was then derived from orange as a complementary secondary color.

The rest of the palette was created using combinations in Adobe’s Color tool using orange as a base.

The Stark accessibility Sketch plug-in was applied to monitor contrast for all usage of type.

The chart colors were also chosen to accommodate color blindness.

The typography system using the Google typeface “Roboto”.

Form fields and other input UI

Dropdowns and tables

Tables with specific states and interactions.

Callouts

Button types

Ayasdi Iris

Case Study

Ayasdi - Codename Iris

Project Info

Using a series of questions and steps, Iris guides the user through encoding data set creation. Automated charts are linked with AI visualizations to facilitate rapid discovery and justification.

Iris created apps allow data to reveal its natural structure and relationships. UI features facilitate a rapid understanding of segments, anomalies + hot-spots.

The Challenge

Ayasdi’s original platform required advanced knowledge of python, had a complex interface, and a steep learning curve. Iris was designed to let people with little to no data science background simply upload data and quickly gain insights into that data.

Ayasdi's mission with Iris was to democratize machine learning and make enterprise level artificial intelligence available to all.

Client

Ayasdi

Dates

05/2018-12/2018

Responsibilities

– UX analysis/research (flows and persona)

– Design (visual and interaction)

– Lo-fi prototyping (basic flow and interactions)

– Hi-fi prototyping (final designs for approval and handoff to dev)

The Approach

Rapid and agile ideation. White-boarding ideas, both good and bad. Then creating very basic wireframes to be used as simple click-through prototypes to refine flows.

Early wire-frames in sketch. These became a preliminary click-through to work out flow ideas. They were also used in preliminary customer testing.

Try out early click flow test v1
Sample screens from click through testing

Testing was performed by staff data scientists, product managers, and later versions by the CEO and upper management.

PMs also tested this early version with a few select customers/power users.

Some charts were thrown in for dramatic payoff including a couple of sample topological plots.

Try user flow test v2 or user flow test v3

First version of flow diagram made from feedback of early click throughs.

The evolving version of the flow diagram after notes and comments from testing new versions of the click throughs.

More formalized card flow diagram. This was the starting point to begin to finalize features as well as how to get to multiple customer journeys.

One of the main desires for the final project was a non-linear work flow. The cards in the top navigation gave status to concurrently rendering processes. The user could go into each section and check progress as well as results for completed activities.

Card navigation is used throughout the product allowing users to preview and compare different models and drill deeper into selected ones.

Interactive charts were designed to show the power of Ayasdi’s predictive modeling algorithms. A heatmap to show the accuracy of predictions and a modeling curve that could be adjusted with a slider for accuracy, precision, and recall.

Visualizations and charting were customizable and an invaluable tool for data insights.

Topological models were what really set Ayasdi apart. Using these models, data was visualized and groupings and outliers are revealed. Interactive charting is combined with the model allowing a user to tune the thresholds within each model to make predictions and insights that might never occur looking at a flat data set.

Pertinent data insights, visualizations, models, and charts could all be pinned to a dashboard. These dashboards could then be set up to monitor trends in the data as well as be used as presentations or documentation.  Notes could be attached for reference or explanation for handoff.

SUMMER SHIFT MAGAZINE

Challenge

Cras tristique turpis justo, eu consequat sem adipiscing ut. Donec posuere bibendum metus. Quisque gravida luctus volutpat. Mauris interdum, lectus in dapibus molestie, quam felis sollicitudin mauris, sit amet tempus velit lectus nec lorem. Nullam vel mollis neque. Lorem ipsum dolor.

customer

Tristique Turpis Ltd.

what we did

Photography / Graphic design / Web design

MUSTACHIO TAG

p-15
p-13
p-23

Challenge

Cras tristique turpis justo, eu consequat sem adipiscing ut. Donec posuere bibendum metus. Quisque gravida luctus volutpat. Mauris interdum, lectus in dapibus molestie, quam felis sollicitudin mauris, sit amet tempus velit lectus nec lorem. Nullam vel mollis neque. Lorem ipsum dolor.

customer

Tristique Turpis Ltd.

what we did

Photography / Graphic design / Web design

BRILLIANT PATTERN

Challenge

Cras tristique turpis justo, eu consequat sem adipiscing ut. Donec posuere bibendum metus. Quisque gravida luctus volutpat. Mauris interdum, lectus in dapibus molestie, quam felis sollicitudin mauris, sit amet tempus velit lectus nec lorem. Nullam vel mollis neque. Lorem ipsum dolor.

customer

Tristique Turpis Ltd.

what we did

Photography / Graphic design / Web design